

The use of continuous glucose monitoring (CGM) in diabetes management can be life-changing. Besides tracking glucose (sugar) numbers every 5 minutes, CGM provides metrics that help you identify patterns and make your numbers less confusing. They can help you uncover the mystery of those stubborn glucose swings!
When you talk with your care team about your CGM data, you might often focus on time in range (TIR), time below range (TBR), and the glucose management indicator (GMI). However, what is often overlooked is how much glucose variability (fluctuations) you might be experiencing.
Fortunately, the level of glucose variability, defined as the “percent coefficient of variation” (often called %CV), is readily available on the Ambulatory Glucose Profile (AGP) Report. We’re diving into what %CV is, how it is calculated, why it is important, and what can be done to lower it—so that you are equipped with the knowledge to do something about it.
What is %CV and how is it calculated?
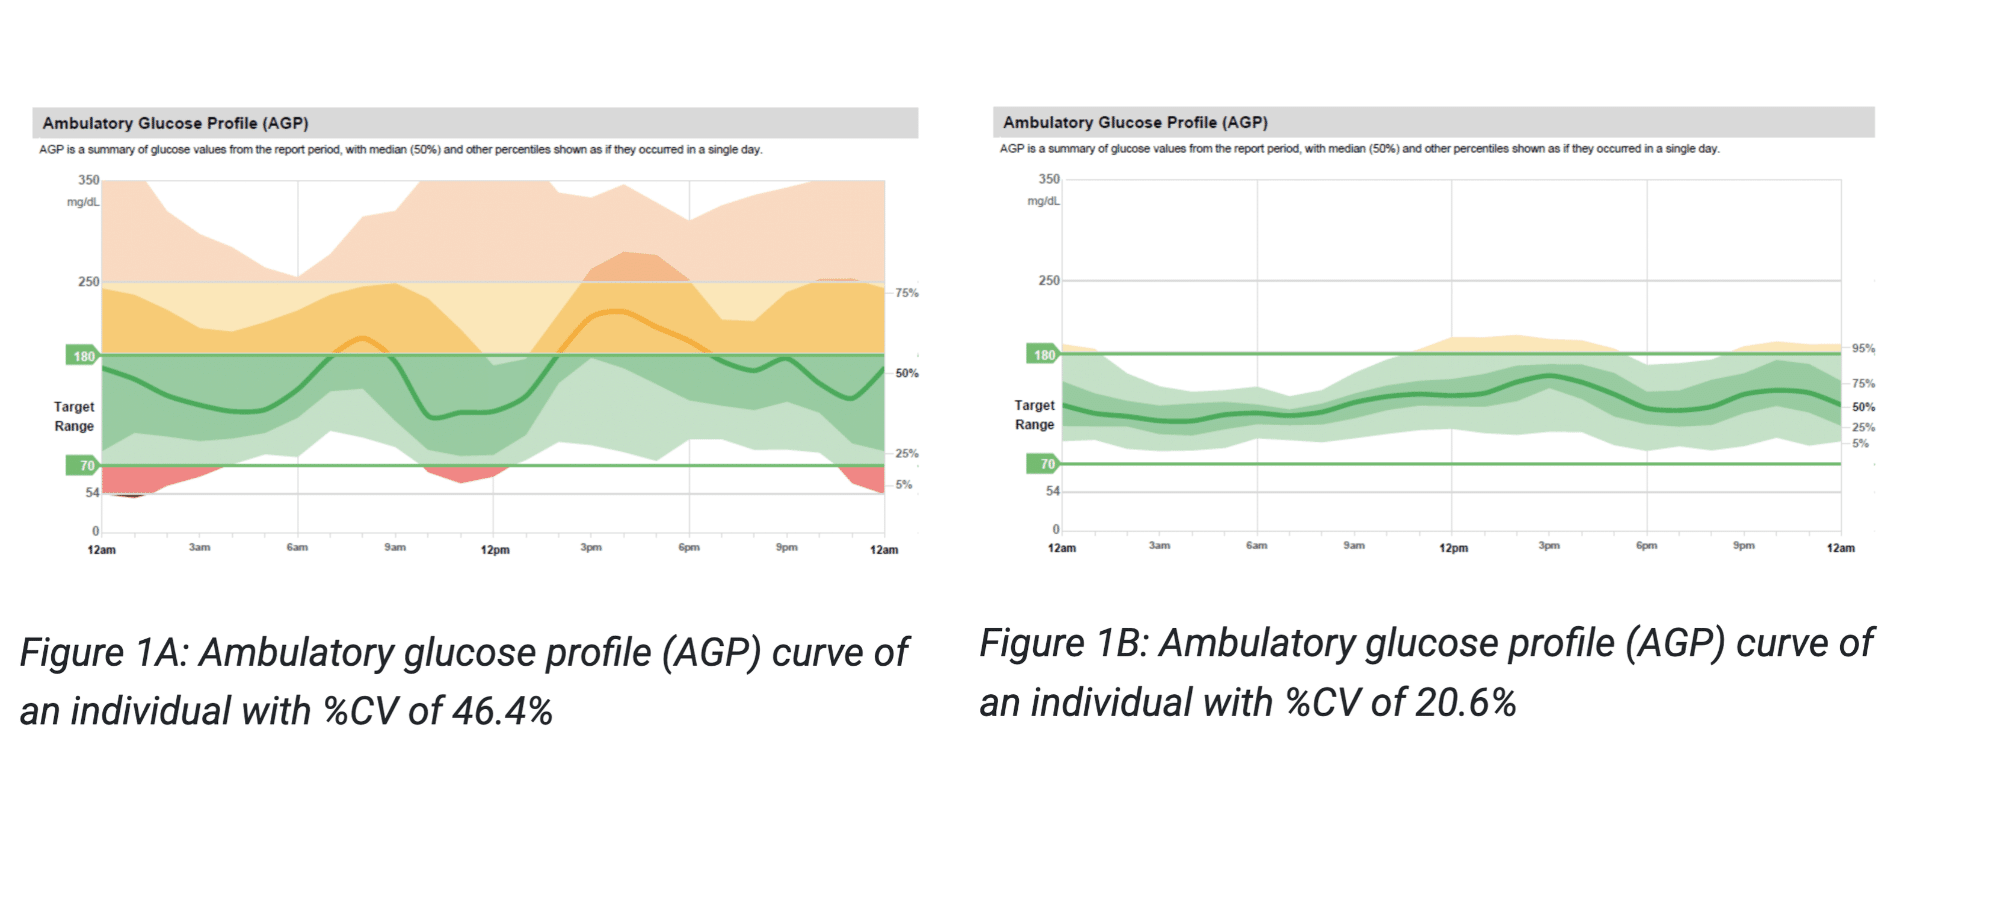
%CV is a measure of variability in glucose readings on your CGM. The higher the %CV, the more variability in glucose. We like to think of variability like a roller coaster. High fluctuations that create big swings are like an extreme coaster, while lower fluctuations create small bumps that are more like a kiddie coaster. It feels better on your body and mind to be riding the kiddie coaster—it means that your glucose levels are staying in range for longer.
To see the difference between a high and low %CV, compare the curves in Figures 1A and 1B. Figure A shows wide fluctuations in glucose that often reach levels above and below range compared to Figure B. The goal is to have an AGP curve closer to Figure 1B that is “flat, narrow and in-range”.1 We know that’s not always possible—there are at least 42 factors that affect glucose levels. But it’s a helpful guide to see where you are on the journey to your goals, whatever they are.
The %CV is reported on the AGP Report as part of the Glucose Metrics section; you can find this in the reports section of your CGM app or desktop account.
Why is %CV important?
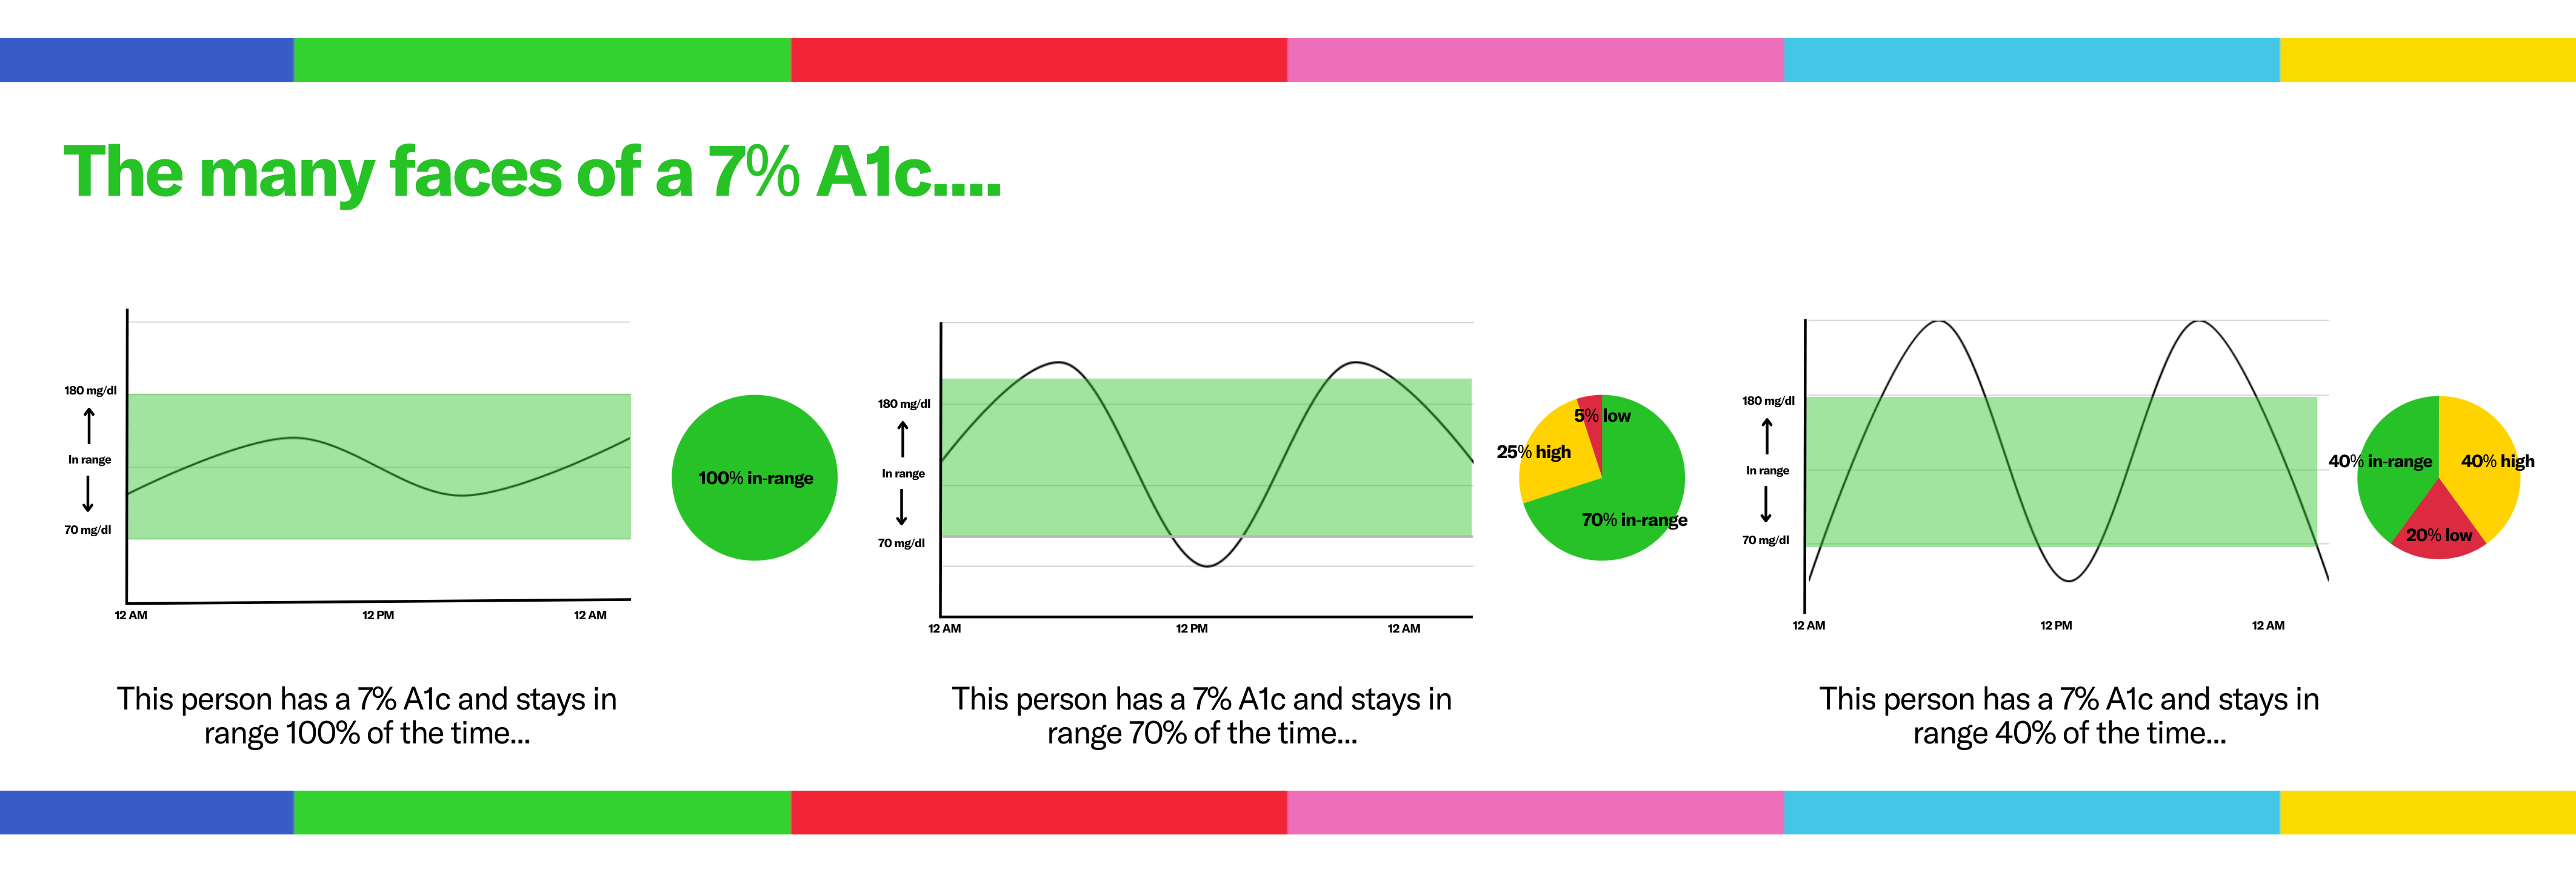
- Two people with diabetes with the same A1C may have dramatically different glycemic variability and %CVs (see Figure 2). Looking at your %CV can help you understand your glucose levels on a deeper level. When you have large swings, your body often doesn’t feel good—by identifying the swings, you can then work to identify the cause of the swings, helping you feel better, faster.
- Research shows that the lower the %CV, the lower the incidence of hypoglycemia (low blood sugar) and TBR. The risk increases as %CV increases.
- High %CV is associated with increased risk of diabetes-related complications, including retinopathy and neuropathy.
What is the target for %CV
The target for %CV is under or at 36%. It was established by international experts, as the risk of hypoglycemia increases significantly above 36%. Studies have shown that a CV of under 33% may decrease the risk of hypoglycemia even more!.3,5
These goals are set to help people with diabetes live the healthiest lives possible, but it’s important to remember to tailor your numerical goals to what makes sense in your management right now. Everyone’s diabetes is different; consider what goals are realistic and attainable to you at that moment in time.
Ways to lower %CV
There are many different things you can do to lower your %CV. Check out some options below!9,11,12
Diabetes Technology
- Start CGM—check out this toolkit on how to get started!
- Use CGM trend arrows to reduce hyperglycemia (high glucose or sugar) and hypoglycemia (low glucose or sugar)
- Talk to your healthcare team about whether an automated insulin delivery (AID) system is right for you
Lifestyle and Nutrition
- Consider adjusting nutrition goals, with glycemic index in mind
- Focus (or re-focus) on carb counting
- Eat vegetables and protein first, followed by carbohydrate
- Include post-meal physical activity (if possible)
- Participate in aerobic exercise and resistance training
Medication
- Take insulin as prescribed (e.g., take mealtime insulin before eating, avoid skipping doses).
- Talk to your healthcare team about how your insulin/medication dosing is helping flatten overnight glucose fluctuations, and if other therapies that don’t increase the risk of low glucose (e.g., GLP-1 receptor agonist-based therapy, SGLT2 inhibitors) are right for you.
%CV seems complicated and a little hard to figure out, we know. But so is diabetes, and you’re living with it every day! CGM metrics like this are exciting and empowering to people with diabetes because they help you understand your body in a way that was impossible 15 years ago. They give you the power to answer your own questions from the palm of your hand and provide information for you to discuss with your diabetes care team. That power is life-changing.
References
- Martens, T W, Simonson, GD, & Bergenstal, RM. Using continuous glucose monitoring data in daily clinical practice. Cleveland Clinic Journal of Medicine, 2024; 91(10): 611-620.
- Bergenstal RM, Ahmann AJ, Bailey T, et al. Recommendations for Standardizing Glucose Reporting and Analysis to Optimize Clinical Decision Making in Diabetes: The Ambulatory Glucose Profile. Journal of Diabetes Science and Technology. 2013; 7(2):562-578.
- Battelino T, Danne T, Bergenstal RM, et al. Clinical targets for continuous glucose monitoring data interpretation: recommendations from the international consensus on time in range. Diabetes care. 2019; 42(8):1593-603.
- Rama Chandran S, Tay WL, Lye WK, et al. Beyond HbA1c: Comparing Glycemic Variability and Glycemic Indices in Predicting Hypoglycemia in Type 1 and Type 2 Diabetes. Diabetes Technology & Therapeutics. 2018; 20(5):353-362.
- Monnier L, Colette C, Wojtusciszyn A, Dejager S, Renard E, Molinari N, Owens DR. Toward defining the threshold between low and high glucose variability in diabetes. Diabetes care. 2017; 40(7):832-8.
- Ceriello A, Monnier L, Owens D. Glycaemic variability in diabetes: clinical and therapeutic implications. Lancet Diabetes Endocrinol. 2019; 7(3):221-230.
- Rodbard D. Hypo- and Hyperglycemia in Relation to the Mean, Standard Deviation, Coefficient of Variation, and Nature of the Glucose Distribution. Diabetes Technology & Therapeutics. 2012; 14(10):868-876.
- Rodbard D. Glucose time in range, time above range, and time below range depend on mean or median glucose or HbA1c, glucose coefficient of variation, and shape of the glucose distribution. Diabetes technology & therapeutics. 2020; 22(7):492-500.
- Wilmot EG, Choudhary P, Leelarathna L, Baxter M. Glycaemic variability: The under-recognized therapeutic target in type 1 diabetes care. Diabetes Obes Metab. 2019; 21: 2599–2608.
- Belli M, Bellia A, Sergi D, Barone L, Lauro D, Barillà F. Glucose variability: a new risk factor for cardiovascular disease. Acta diabetologica. 2023; 60(10):1291-1299.
- Xu Y, Dunn TC, Bergenstal RM, et al. Time in range, time in tight range, and average glucose relationships are modulated by glycemic variability: Identification of a glucose distribution model connecting glycemic parameters using real-world data. Diabetes Technology & Therapeutics. 2024; 26(7):467-77.
- Zhou Z, Sun B, Huang S, Zhu C, Bian M. Glycemic variability: adverse clinical outcomes and how to improve it?. Cardiovascular diabetology. 2020;19(1):102.